Introduction
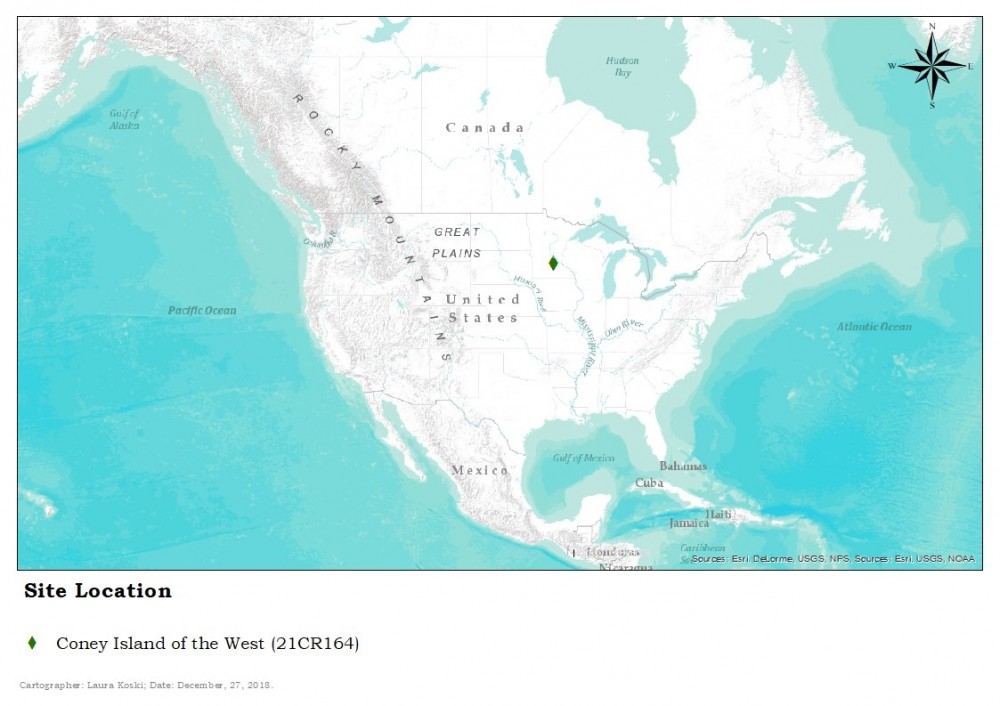
The following is a case study exploring how ArcGIS was incorporated in the zooarchaeological analysis of Coney Island of the West (21CR164): a 32-acre island in Lake Waconia, Waconia, Carver County, Minnesota in the Midwestern United States. Coney Island is a multi-component site spanning prehistoric to historic usage, followed by modern use by the occasional trespasser. The expansive nature of the site, as well as its multiple phases of occupation, make it an ideal candidate for a spatial analysis study. This paper is not intended to be a discussion regarding the zooarchaeological methods involved in the analysis of the faunal material, but is rather a focus on the valuable potential for the use of Geographic Information Systems (GIS) in a zooarchaeological context. For a detailed discussion of methodology, faunal identifications, and their implications for resource procurement and subsistence practices please refer to the paper Bone Tools, Elk Dishes, and Life on the Lake: A Zooarchaeological Analysis of Coney Island of the West (21CR164), Waconia, Carver County, Minnesota (Koski 2018).
This case study is by no means the first instance in which GIS spatial analysis has been used in a zooarchaeological context, but it is one of relatively few examples worldwide. The technique is growing, however, and this paper is intended to be just one more example of why this method should be more heavily utilized on the whole. One of the few published examples of the method regards El Mirón Cave in eastern Cantabria, Spain (Arroyo 2009). Within the paper, Marín Arroyo highlights the strong point that while GIS has been heavily utilized for archaeological site predictive modelling, mapping of known sites for future development planning and research, or for catchment area definition, the mapping software has actually been utilized relatively minimally in the visual display and organization of single archaeological site material distributions (Arroyo 2009, 507). In an attempt to both address this discrepancy, and to discover if spatial analysis could prove useful for the understanding of this individual site, a specific zooarchaeological GIS was prepared. An extra step including factorial and local density analyses was also completed as a means of reinforcing the overall site interpretation (Arroyo 2009). This study is of particular relevance to the Coney Island case study due to the fact that both sites contained mixed contexts from different periods and separating out the faunal material into context and activity areas was heavily aided by spatial analysis.
One of the most impressive examples of the method’s implementation on a regional scale was its use in the Paraná River flood plain (Sartori et al. 2014). In this study, Sartori et al. mapped the taxonomic data from twenty-six different sites within the flood plain in an attempt to discern the similarities and differences in wildlife resource utilization across those hunting, gathering, and fishing within the region. The resulting data allowed for both micro-regional and macro-regional spatial and temporal comparisons across sites and aided in some understanding of the distribution of species within the flood plain in the past (Sartori 2014). Sartori’s study was completed on a grander scale than that of Coney Island, but the taxonomic GIS data generated for the island would be of great use to a regional scale zooarchaeological model for the state of Minnesota or the greater Midwest in the future.
Site Background
This review of the island’s background is summarized and focuses on the elements important specifically to the faunal and spatial analysis of the site. For a thorough accounting of the site’s known history and prehistory, see the report A Phase I Cultural Resource Assessment of the Proposed Lake Waconia Regional Park, Coney Island of the West, Waconia, Carver County, Minnesota by Blondo Consulting (Blondo, Wolf & Koski 2017).
The site was already listed in the National Register of Historic Places (CR-WAT-001) before Blondo Consulting was contracted to research and survey the site in the fall of 2016. It is listed for containing the remains of a well-document historic resort that has been referred to in the past as Coney Island Hotel and later Paradise Isle Resort (Waconia Heritage Association 1986). The resort was initially developed between 1884 and 1886, marking the first recorded consistent usage of the island (Waconia Heritage Association 1986).
The previous pre-contact occupation was discovered during Blondo Consulting’s Phase I survey of 2016 and was further explored during the Phase II survey of 2017. Pre-contact materials included lithic and ceramic fragments mixed with a variety of faunal material. The potential period(s) and cultural origins of the pre-contact material is not directly relevant to the topic of this discussion and will therefore not be discussed in detail. For those interested, the report The Phase II Additional Analysis of the Coney Island of the West Site (Site 21CR0164), Waconia, Carver County, Minnesota (Blondo & Wolf 2018) discusses the pre-contact artefact analysis at length.
Methods
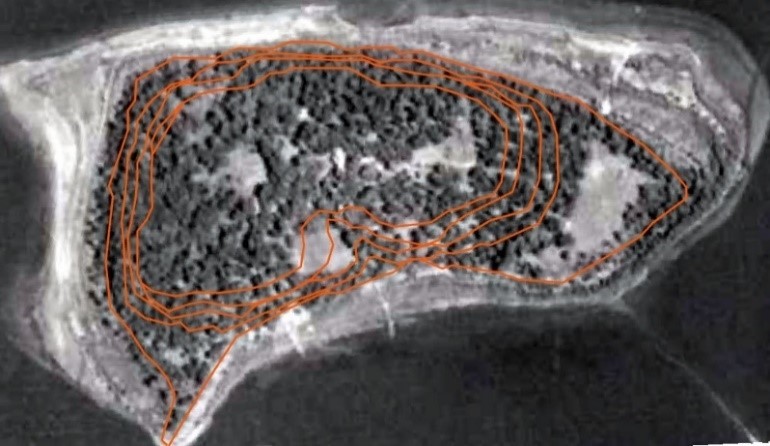
One of the most valuable mapping measures that helped give greater context to the faunal assemblage was investigating historic maps for the island to examine how its use has changed over time. Today, the entirety of the island is surrounded by a slim beachline, but 1940 aerial imagery located at the University of Minnesota John R. Borchert Map Library revealed that the beach once extended much further. Aerial imagery for successive years up until the modern day indicates that the water level has slowly risen since the mid-twentieth century, shrinking the usable portions of the island. The beach area available in the 1940s extends as much as approximately 25 meters out at the southwestern peak, and as much as 100 meters out on the north eastern edge (Figure 2).
It should be noted that vegetation visible in the aerial imagery is slight on the extra beach areas when compared to the heavy vegetation on the main body of the island that can be seen today. It is important when interpreting distribution of faunal material to understand that the beach areas that are accessible at low lake depths may have been intermittently available over the past thousands of years that the island has existed, indicating other faunal deposits may be present along these submerged beachlines.
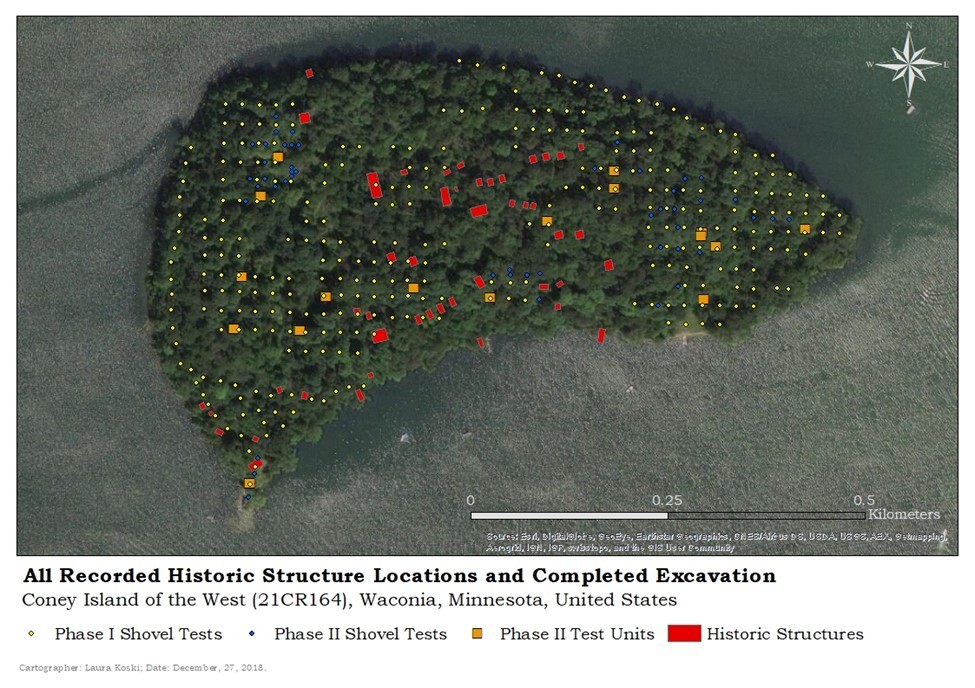
After both seasons of fieldwork were completed, all first season shovel test (n = 305), second season test unit (n = 18), and second season shovel test (n = 47) locations were drawn into ArcMap by the author utilizing a georeferenced hand-drawn field map created by Dr. Jeremy Nienow, one of the Principal Investigators for the project (Figure 3).
Test units were one meter by one meter and were excavated twenty centimetres past culturally sterile soils. Attribute tables were created for the shovel test and test unit shapefiles. Since depths were not consistently recorded for artefacts recovered from shovel tests, the shovel test attribute table consisted of only five entered data columns: shovel test number, a positive/negative column, and columns named ‘historic’, ‘prehistoric’, and ‘faunal’ (Figure 4).
Faunal was designated as a separate category because at this stage it was unclear whether the material was prehistoric, historic, or natural in origin. If materials were recovered from a shovel test, a ‘yes’ would be entered in the positive column; if not, a ‘no’. If any of the aforementioned materials were recovered from a shovel test, a ‘yes’ was entered into the appropriate historic/prehistoric/faunal cell. This original shovel test map was then queried, searched, clipped, and symbolized to aid in excavation planning for the next season. Areas with highest activity potential were identified, and the next season’s test units were strategically placed within and around those areas.

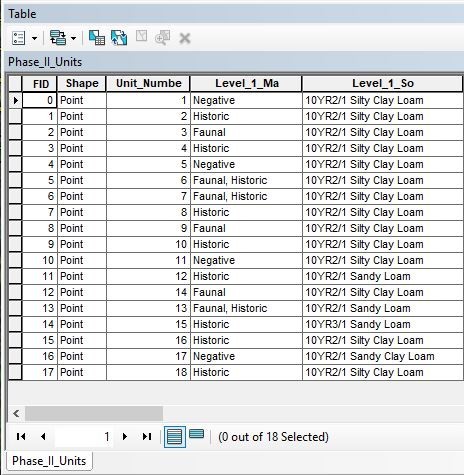
Due to the greater amount of spatial data recorded during test unit excavation in the second field season, the test unit attribute tables were more complex than the shovel test pits (Figure 5).
Two columns were created for each level of every test unit (each level having been five centimetres in depth). The first column for each level listed the types of materials recovered from the test unit using the same terminology as the first season: ‘historic’, ‘prehistoric’, or ‘faunal’. The second column for each level contained soil type information recorded in the field (colours referenced using a Munsell soil colour book). This second column was required because there was a notable amount of soil disturbance and fill episodes recorded during the island’s resort era, and some of those fill soils were recorded as having been shipped in from the mainland. The soil information mapped at each level was to help in identifying typical soils for different areas of the island, which soils may have been moved from elsewhere on the island, and which soils were potentially foreign to the island. This information was then used to determine artefact deposits that were potentially no longer in situ, and where they may have originated. Maps were then also created displaying the recorded material content level by level across the island to track the potential for soil depth and type consistencies between cultural periods of the island. This portion of the GIS mapping was the first step in spatially analysing the origins of the faunal material, and whether it may have been deposited prehistorically, historically, or naturally.
It should be noted that the faunal material was examined for cultural modifications in order to aid in determining which material may be cultural and which may be natural. However, the effects recorded included burning/calcification, spiral fracturing, cut marks, rodent gnawing, etc. These effects could occur in a prehistoric or historic setting and are not truly indicative of either. This is why the spatial analysis played the key role that it did in the overall understanding of past activities on the island. Another method some may use to determine cultural versus natural deposits is the faunal material’s association with other cultural remains. While this can be a useful measure, there are some caveats that the author has found to be frequently overlooked.
The first issue with this assumption is that in wild areas, such as Coney Island of the West, temporary campsites, and even long-term sites, will always be susceptible to naturally deposited materials within the same stratigraphic level. Humans may have kept the area clean while occupying it, but carcasses or carcass portions can always be deposited soon after that occupation has ended. Taphonomic processes may disturb the carcass to the degree that it would not classify as an Animal Bone Group upon excavation, and the materials are assigned to the cultural activity of the area. Conversely, scant amounts of bone recovered with an absence of clear cultural material may be interpreted as a natural deposit when it may just as likely have been a brief midden deposited far from the occupation area to avoid scavengers or the unpleasant smell, or the individuals involved happened to leave no other refuse during a brief campsite occupation. Both are dangerous assumptions that are simply too easy to make.
In an attempt to avoid this, the author chose to look closely at the contexts in which faunal material was recovered with either or both prehistoric and historic material, when it was recovered on its own, the vertical soil types and depth in which the material resided, and the horizontal patterning of material deposition across the island. These methods reaped benefits for understanding areas of activity across the island and determining the cultural or natural origins of the material to a reasonable degree of certainty. For the sake of brevity, the results discussed in this paper will cover the two areas of the island in which this spatial analytical methodology revealed the most useful and interesting conclusions that may not have been otherwise revealed without a detailed study of spatial distribution of the faunal material. For clarity, these areas are divided into Area A and Area B. All GIS mapping and analysis was completed by the author, except the non-extant historic building locations which were generated and provided by Carver County Parks and Recreation Department.
Results
Area A
This first area is located at the southwestern tip of the island on a short peninsula (Figure 6). While it is the smallest area, it contains the highest amount of faunal material recovered from the island by far (n = 56 percent), with an exceptional amount of taxonomic diversity, cultural modifications, and a relatively small quantity of associated prehistoric ceramic and lithic materials (see Appendix).
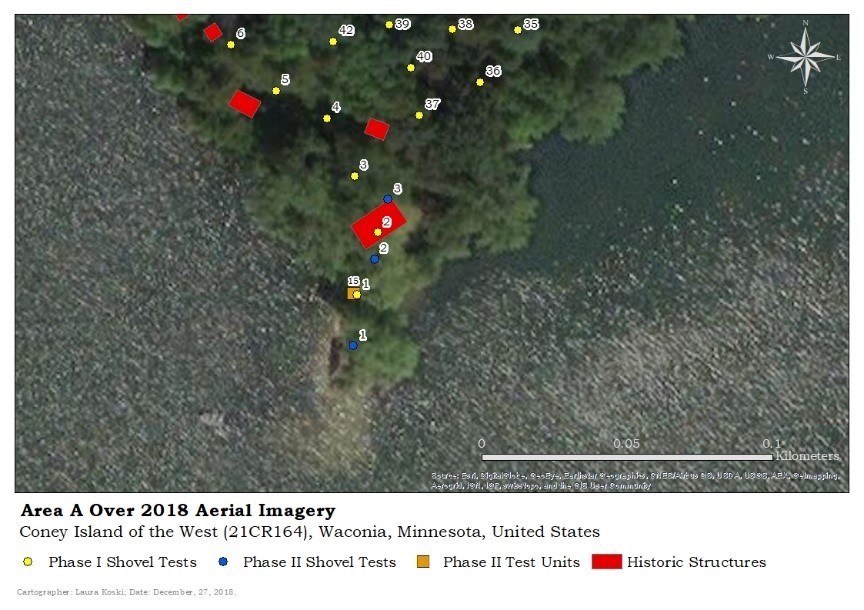
While the diversity is impressive, its spatial context must be explored. Approximately 27 percent of the faunal assemblage in this area was recovered from TU 15 (n = 79), while approximately 72 percent was recovered from Phase II ST3 (n = 205). This disparity is notable, especially when considering the TU was one meter by one meter, and faunal material was identified at a depth of 75 centimetres below surface. Additionally, Phase II ST3 was only approximately 40 to 50 centimetres in diameter, and the faunal material remained consistently dense to 120 centimetres below surface. The faunal material in TU 15 was recovered between 10 and 75 centimetres with varying densities and taxonomy by level, but in Phase II ST3 the faunal material was incredibly dense throughout with a balanced taxonomic mix regardless of depth, along with a mixture of historic glass and asphalt shingle, and prehistoric lithic material throughout. It is also important to note that TU 15 consisted of defined stratigraphic levels throughout while Phase II ST3 contained one sandy soil type for the entirety of the 120 centimetres. A quick check for this soil across other soil types recorded at varying depths across the island utilizing the GIS data revealed that it was not identified elsewhere during the investigation.
All of the above makes it clear that Phase II ST3 is comprised of fill soils from an unknown location. This makes the shovel test an out of context anomaly that unfortunately contained approximately 40 percent of the total faunal assemblage. However, an investigation of the historic use of this peninsula utilizing the aforementioned 1940 aerial imagery provided a viable answer.
While Area A was not used as part of the overall resort, it was privately owned by Frenchman Emile Amblard beginning around 1893 up until his death around 1914 (Waconia Heritage Association 1986; Bingham 1915). Amblard was infatuated with his island property and built a number of structures. Of specific interest to this analysis is the sea wall he built up around his estate (Waconia Heritage Association 1986). Remnants of this wall are observable today. During the fieldwork it was noted that the area within the existing sea wall is heavily built up; ultimately standing roughly a meter above the lake level near the area Phase II ST3 was excavated. This would confirm that fill soils would have had to come from somewhere to build the earth up behind the sea wall in such a way. Transporting fill soils from the mainland at the time would have been a costly and clumsy ordeal. Therefore, a likely possibility is that the sandy fill soils originated along one of the extended beach areas that are visible in the 1940s aerial imagery, but underwater today (see Figure 2). This is also supported by the fact that the majority of taxa identified within Phase II ST3 were recovered from elsewhere on the island.
If the sandy fill soils identified within ST3 do originate from the extended beaches of Coney Island, then the location where the cultural and faunal materials originate would comprise by far the majority of animal resources utilized on the island. The animal resources procured and processed prehistorically at the original campsite could include river otter, American badger, racoon, beaver, muskrat, rabbit, elk, deer, snapping turtle, swan, mallard, wood duck, northern pike, muskellunge, pumpkinseed, and others that could not be identified during analysis. This diversity of large land mammal, small land mammal, aquatic mammal, waterfowl, turtle and fish could imply a wide variety of resource procurement strategies ranging from bow and arrow to clubbing, netting, hook and line fishing, and spear hunting. The diversity of species also suggests this camp could have been used in all seasons and was perhaps returned to several times in the same year to take advantage of the seasonal animal resources available on the island, in the lake, and on the surrounding mainland.
Area B
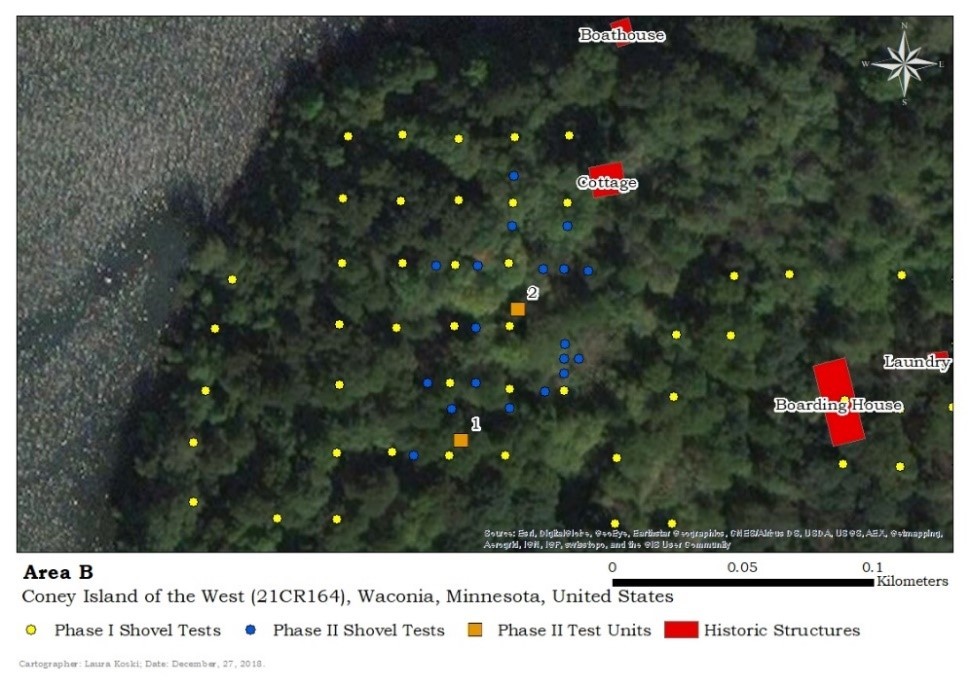
Area B is located on the north-western corner of the island (Figure 7). Bordering the area on the north and west sides is a tall and steep slope that leads down to a slim beach meeting the waterline. The remains in this area consisted of a light scatter of bone belonging to deer, duck, great blue heron, turtle, and a great deal of fish (see Appendix).
Fish represented both the greatest quantity of remains (n = 105) and diversity of taxa which included black/brown/yellow bullhead, pumpkinseed, Lepomis macrochirus (bluegill), Lepomis sp. (small sunfish), Perca flavescens (yellow perch), Castostomus commersonii (white sucker), and Poxomis sp. (crappie).
While working through the cultural material to identify the faunal remains, it became evident that a number of shovel tests contained only faunal material mixed with no prehistoric or historic cultural material (note in Figures 8 and 9 the larger light blue dots are the highlighted query results).
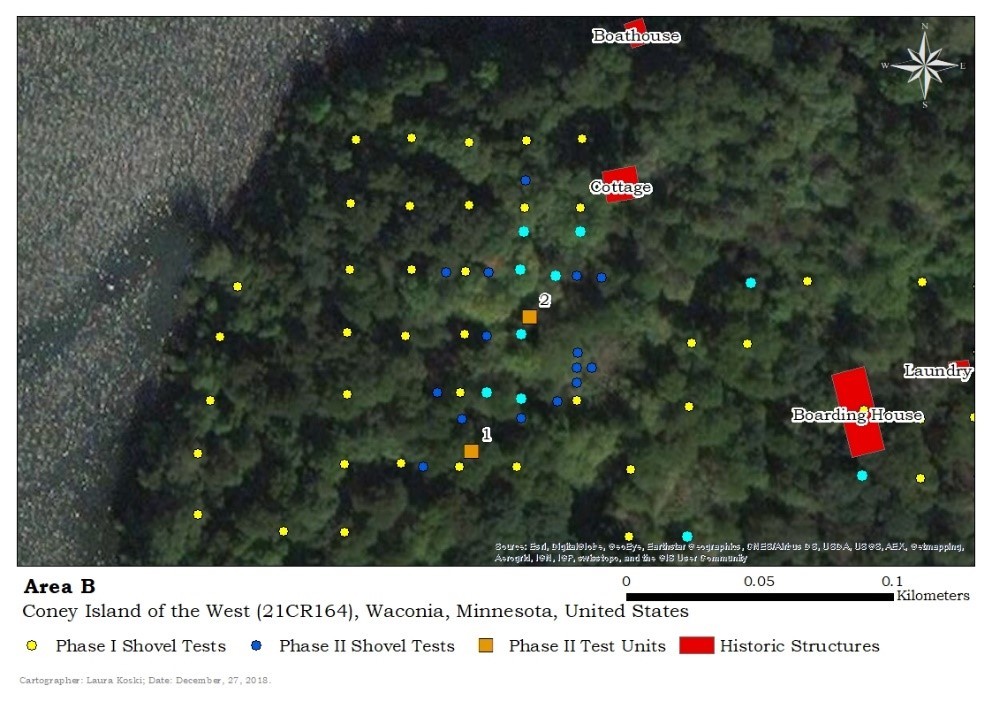
The faunal material in question was comprised nearly entirely of various cranial elements of medium to small fish remains including bluegill, pumpkinseed, white sucker, and yellow perch. This raised the question of whether these fish remains were culturally or naturally deposited. The remaining faunal material was identified in context with prehistoric materials starting at similar depths in TU 1 and TU 2, and therefore these remains were not included in the spatial analysis undertaken to investigate the pattern.
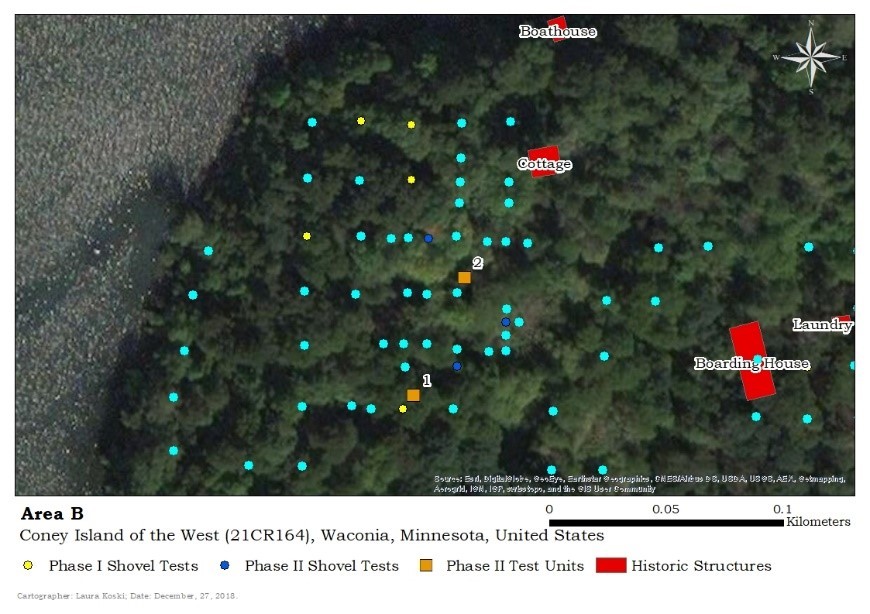
As can be seen in the Area B maps, there is a non-extant cottage mapped just to the northeast of this area with an associated dock down at the water’s edge. The first test was to determine if these fish remains were remnants of the resident cleaning or eating their fish near the cottage. Another query was completed to discern the extent of historic cultural material (maybe the fisherman left his beer bottles where he cleaned his fish). This found nearly no historic material across the entire area, and absolutely none in context with the scattered fish remains. To follow-up, another query was completed to determine the extent of prehistoric cultural material. Again, this was found to be extremely scant. Figure 9 demonstrates the query displaying all shovel tests that contained neither historic nor prehistoric material.
Scant historic materials were nearly only identified in Unit 2, while prehistoric materials started consistently at the same levels between both Units 1 and 2. This implied that very little historic material-related activity occurred in this area of the island. It could also indicate that the residents cleaned up their debris well, but if they did the fish carcasses must have been a severe oversight.
The next consideration was the varying depth of the fish remains. The remains were recovered approximately between ground surface and 60 centimetres below ground surface. The depositing activity would need to occur over several hundred years for remains to accumulate at such varying depths, which would pre-date recorded Euro-American historic activity on the island. The last factor left to consider was the taxa represented in the deposits. All taxa represent medium to small size fish, and most, including the sunfish (bluegill and pumpkinseed) and yellow perch, are favoured cormorant prey. This last factor leads the investigation to its most reasonable explanation for the unusual fish deposit.
Tree-nesting waterfowl, such as cormorants (Phalacrocorax auritus), have been observed frequently on Coney Island for at least one hundred years (Williams 2011; Meersman 2012). Cormorants nest in groups of hundreds at a time mixed with other waterfowl like great blue heron (also recorded on the island). These fish are preferred catches for cormorants due to their tasty flesh, manageable size, and the fact that they are easily caught by a variety of waterfowl while they are sunning in schools near the shore (Hundt, Simons & Pereira 2013). Once caught, the cormorant will quickly swallow the fish, possibly catch a few more, then head back to its nest in the tree tops. This fish will either be regurgitated to feed the chicks of the flock, or the cormorant will regurgitate the undigestible skeletal remains over the side of the nest, and let it fall to the ground beneath (Hundt, Simons & Pereira 2013). The consistent density of fish remains in these levels scattered across the island’s north western corner would align well with the general size of cormorant roosting areas, and the fact that cormorants will annually return to their favoured nesting spots (Williams 2011; Meersman 2012; Hundt, Simons & Pereira 2013). This location is near the shore but is tucked into the tree-break of the island in such a way that the nests would be protected from the strong wings that often graced the north western corner of the island. Lastly, cormorant and great blue heron remains were recovered in low frequencies in context with prehistoric materials on the island during excavation, indicating that cormorants would have been nesting on the island over the several hundred-year time span the fish deposits would have accumulated.
Conclusion
GIS has a clear and present role in modern archaeological understanding, and fortunately professionals in the field are utilizing it to a steadily greater degree over time. The goal of this paper, however, is to encourage more frequent use within zooarchaeological analysis in particular. The zooarchaeologist has a slightly more complex role than that of the ceramic or lithic analyst in that the cultural relationship between that of the fauna in question and humans is typically more dubious; requiring a more thoughtful and investigative analysis. Spatial analysis is just one such tool that should be on the belt of any zooarchaeologist willing to pursue it. It opens informative windows that are otherwise kept tightly shut when the analyst consistently maintains a protocol strictly bent on identifying taxa, measurements, and taphonomic modification. Humans and animals have always lived within, organized, and utilized their space in ways we cannot understand without studying the patterns, consistencies and inconsistencies of that space. It is time that serious faunal analyses begin to give that sense of space more weight in the greater scheme of archaeological analysis.